Data Analytics with Tableau
Data Analytics with Tableau is a specialised programme that equips learners with the ability to interpret complex datasets and convert them into visual narratives. Through this data analytics with tableau course, participants can uncover insights, track performance, and influence decision-making processes. Unlike generic tools, Tableau offers dynamic features, and this data analytics with tableau course online ensures learners are introduced to database concepts, case-driven projects, and storytelling techniques. With tableau training for beginners, students progress from foundational knowledge to advanced projects covering retail, HR, shipping, and stock analytics. The curriculum builds a robust base, making this one of the best tableau courses for professionals seeking growth.
Overview
Picture yourself stepping into a world where data no longer feels overwhelming but instead tells a clear, captivating story. The Data Analytics with Tableau Course is not just about learning a tool – it’s about transforming the way you think, present, and influence. With a curriculum designed around real business cases like Discount Mart, Green Destinations, and Tesla stock analysis, you will uncover the power of data-driven storytelling. Whether you are searching for tableau training for beginners or seeking the best tableau courses available, this programme provides everything to start your journey with confidence.
What makes this tableau course online unique is the balance between technical learning and creative exploration. You will progress from simple visualisations to building dashboards that reveal critical insights, connecting business challenges with clear solutions. The course even includes a bonus introduction to database concepts, ensuring your skills extend beyond charts into structured data management. For learners exploring a tableau course or a comprehensive data analytics with tableau course online, the projects included here replicate industry realities and build long-term capability.
By the time you complete the programme, you will not only know how to create visually engaging dashboards but also how to weave narratives that inspire decision-making. With modules covering retail, HR, shipping, and financial analytics, you’ll walk away with an impressive portfolio. Choosing this data analytics with tableau course is more than just learning software – it’s investing in a skillset that employers across industries actively demand.
Note: Skill-up is a Janets-approved resale partner for Quality Licence Scheme Endorsed courses.
Learning outcome
- Apply Tableau tools to design interactive dashboards for varied industries.
- Interpret datasets to highlight business performance and organisational trends.
- Demonstrate data storytelling skills using Tableau Stories.
- Integrate database concepts into analytical workflows for improved outcomes.
- Conduct analytics on projects including retail, HR, shipping, and stock price trends.
Course media
Certificate of Achievement
Quality Licence Scheme Endorsed Certificate
Upon completing the final assessment, you can apply for the Quality Licence Scheme Endorsed Certificate of Achievement. Endorsed certificates can be ordered and delivered to your home by post for only £119.
Order Your QLS Certificate
An extra £10 postage charge will be required for students leaving overseas.
Skill Up Recognised Certificate
Upon successful completion of the Data Analytics with Tableau course, you have the opportunity to request a Skill Up Recognised Certificate. This certificate holds significant value, and its validation will endure throughout your lifetime.
- 1. PDF Certificate + PDF Transcript: £14.99
- 2. Hardcopy Certificate + Hardcopy Transcript: £19.99
- 3. Delivery Charge: £10.00 (Applicable for International Students)
Why should I take this course?
- Individuals seeking tableau training for beginners.
- Professionals searching for the best tableau courses to enhance career prospects.
- Students looking for a tableau course to initiate their analytics journey.
- Analysts who prefer flexible tableau course online study options.
- Learners pursuing a data analytics with tableau course online for career advancement.
Career Path
- Data Analyst – £32,000 to £50,000 per year
- Business Intelligence Analyst – £38,000 to £55,000 per year
- Tableau Developer – £40,000 to £60,000 per year
- Data Visualisation Specialist – £37,000 to £54,000 per year
- Reporting Analyst – £30,000 to £47,000 per year
- Analytics Consultant – £45,000 to £70,000 per year
Requirements
- Basic understanding of data concepts.
- Interest in learning data analytics.
- Reliable internet connection for online learning.
Curriculum
-
Introduction to the Course
00:02:00
-
What is Tableau?An Introduction to Tableau
00:03:00
-
How this course is Structured
00:01:00
-
Installing the Free Full Version of Tableau
00:02:00
-
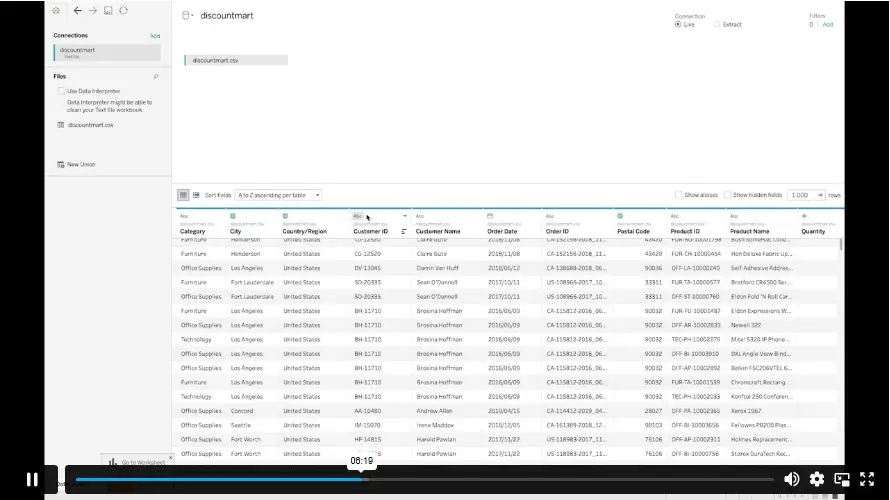
Project Brief for Discount Mart
00:03:00
-
Connecting and Preparing Data for Discount Mart
00:15:00
-
Building Charts on Tableau for Discount Mart (Part 1)
00:33:00
-
Building Charts on Tableau for Discount Mart (Part 2)
00:16:00
-
Creating Headline Cards on Tableau for Discount Mart
00:10:00
-
Building and Publishing Dashboards on Tableau
00:15:00
-
Project Brief for Green Destinations
00:02:00
-
Connecting and Preparing Data for Green Destinations
00:09:00
-
Building Charts on Tableau (Part 1) for Green Destinations
00:29:00
-
Building Charts on Tableau (Part 2) for Green Destinations
00:08:00
-
Creating Headline Cards on Tableau
00:15:00
-
Building a Dashboard for Green Destinations
00:12:00
-
Publish your Dashboard to Tableau Public
00:03:00
-
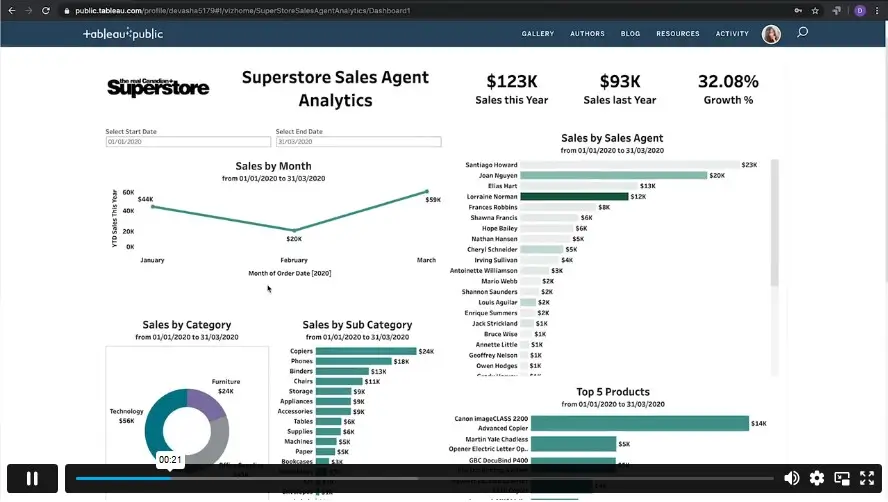
Project Brief for Super Store
00:02:00
-
Connecting and Preparing Data for Super Store
00:17:00
-
Building Charts on Tableau (Part 1) for Super Store
00:34:00
-
Building Charts on Tableau (Part 2) for Super Store
00:23:00
-
Building a Dashboard
00:18:00
-
Publish your Dashboard to Tableau Public
00:03:00
-
Project Brief for Northwind Trade
00:08:00
-
Connecting and Preparing Data for Northwind Trade
00:14:00
-
Building Charts on Tableau for Northwind Trade
00:37:00
-
Building and Publishing Dashboards for Northwind Trade
00:10:00
-
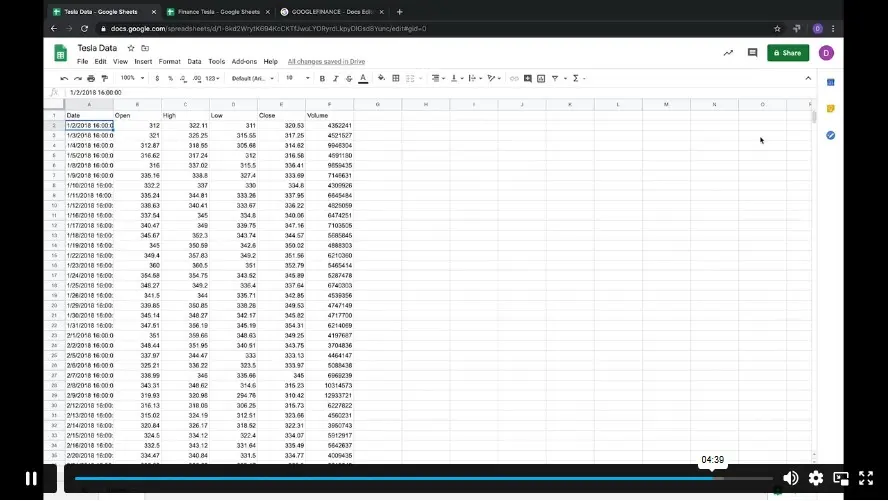
Project Brief for Tesla
00:02:00
-
Creating a Data Source through Google Sheet Functions
00:05:00
-
Connect to the Data for Tesla
00:04:00
-
Building Charts on Tableau for Tesla
00:22:00
-
Building Headline Cards
00:09:00
-
Building a Tesla Dashboard
00:08:00
-
Publish your Dashboard to Tableau Public
00:03:00
-
Introduction to Database Concepts
00:01:00
-
Understanding Relational Databases
00:04:00
-
Relationships of Database Entities
00:02:00
-
Primary and Foreign Keys
00:01:00
-
Data types and Naming Conventions
00:04:00
-
Creating Stories on Tableau
00:05:00
-
Resources – Data Analytics with Tableau
-
Submit Your Assignment & Order QLS Certificate
-
Skill Up Recognised Certificate
-
Order CPDQS Certificate
Offer Ends in
-
Duration:6 hours, 54 minutes
-
Access:1 Year
-
Units:44

56 Reviews
All
Courses for £49