Data Analytics with Tableau Course
If you want to develop stronger data visualisation and analytics abilities using one of the most recognised business intelligence platforms, the Data Analytics with Tableau Course is designed to introduce structured data analysis and dashboard creation through practical project-based training. In today’s data-driven environment, organisations increasingly depend on visual reporting to support informed decision-making and business performance.
This course introduces learners to Tableau fundamentals, data connection processes, chart building, dashboard development, publishing workflows, and analytics techniques used across sales, HR, shipping, and business intelligence projects.
Learners work through multiple real-world style projects that demonstrate how raw data can be transformed into meaningful insights through visual storytelling and interactive dashboards.
- Explore chart creation and dashboard development techniques
- Build interactive reports across business scenarios
- Publish dashboards and share insights effectively
- Understand core database concepts and relationships
- Create Tableau stories to present analytical findings
Whether you are starting your journey into analytics or looking to strengthen digital business reporting abilities, this course supports stronger confidence in working with data visualisation tools.
What Is Data Analytics with Tableau Course?
The Data Analytics with Tableau Course focuses on introducing learners to the principles of business analytics and visual reporting using Tableau. Tableau is widely used to convert complex datasets into clear visual dashboards that support better decision-making.
Learners explore how to connect data sources, prepare datasets, build charts, design dashboards, and publish interactive reports through guided projects. The training introduces analytics concepts across sales performance, HR insights, shipping analysis, and stock monitoring scenarios.
The course also introduces database foundations including relational databases, entity relationships, primary keys, foreign keys, data types, and naming conventions to strengthen understanding of structured data environments.
By completing this course, learners develop stronger capability in transforming business data into clear visual insights.
Course Description
The Data Analytics with Tableau Course begins with an introduction to Tableau and explains how the platform supports business intelligence and data reporting. Learners explore installation, course structure, and core Tableau functionality.
The training progresses into practical analytics projects designed to simulate workplace reporting environments. Learners connect and prepare datasets before building charts, headline cards, dashboards, and publishing reports.
Project-based modules cover sales and profit analytics, HR analytics, sales tracking, shipping analytics, and stock price analytics. Each project introduces practical reporting scenarios and dashboard creation workflows.
Additional modules introduce essential database concepts including relational structures, entity relationships, primary and foreign keys, and data types. These lessons strengthen understanding of how business data is organised and analysed.
The course concludes with Tableau Stories, where learners explore methods for presenting analytical findings through structured visual narratives.
Learning Outcome
- Understand Tableau and its core functions
- Install and configure Tableau for analytics use
- Connect and prepare datasets for analysis
- Build charts and visual reports
- Create interactive dashboards
- Publish dashboards using Tableau Public
Course media
Who Is This Course For?
- Beginners interested in data analytics
- Business professionals working with reporting
- Students exploring business intelligence tools
- Marketing and sales professionals analysing performance
- HR professionals interested in workforce analytics
Why Enrol in This Data Analytics with Tableau Course?
Data visualisation and analytics continue to support modern business operations across industries. Organisations rely on dashboards and reporting systems to identify trends, measure performance, and support operational planning.
This course provides structured training through practical Tableau projects that demonstrate how data can be transformed into meaningful insights. Learners explore chart building, dashboard creation, publishing, and analytics workflows.
Tableau supports visual storytelling by making complex information easier to interpret and communicate. Developing familiarity with these tools helps support stronger reporting and business analysis capabilities.
Whether for career development or professional growth, this course introduces essential analytics and visualisation concepts through practical learning.
Data Analytics with Tableau Course Career Path
Knowledge of data analytics and Tableau supports opportunities across business intelligence, reporting, operations, finance, and analytics environments.
Typical career pathways include:
Data Analyst — £30,000–£50,000
Collects, interprets, and visualises business data to support decision-making.
Business Intelligence Analyst — £35,000–£60,000
Develops reporting systems and interactive dashboards for business insights.
Data Visualisation Specialist — £35,000–£55,000
Creates visual reports that communicate analytical findings clearly.
Reporting Analyst — £28,000–£45,000
Builds and maintains business reporting processes.
HR Data Analyst — £32,000–£50,000
Uses analytics to support workforce reporting and planning.
Operations Analyst — £30,000–£52,000
Reviews business performance data and operational trends.
Professionals with Tableau and analytics abilities can progress into business intelligence leadership, analytics management, and data-focused roles.
Enrol Today – Build Your Data Analytics Skills
By enrolling in this Data Analytics with Tableau Course, you begin developing stronger abilities in data visualisation, reporting, and dashboard creation.
Learn how to connect datasets, build interactive dashboards, publish reports, and communicate business insights using Tableau.
Start building your analytics capabilities and strengthen your future opportunities in data-driven environments.
Certificate of Achievement
Quality Licence Scheme Endorsed CertificateÂ
Upon completing the final assessment, you can apply for the Quality Licence Scheme Endorsed Certificate of Achievement. Endorsed certificates can be ordered and delivered to your home by post for only £119.
Order Your QLS CertificateÂ
An extra £10 postage charge will be required for students leaving overseas.Â
Skill Up Recognised Certificate
Upon successful completion of the Data Analytics with Tableau course, you have the opportunity to request a Skill Up Recognised Certificate. This certificate holds significant value, and its validation will endure throughout your lifetime.
- 1. PDF Certificate + PDF Transcript: £14.99
- 2. Hardcopy Certificate + Hardcopy Transcript: £19.99
- 3. Delivery Charge: £10.00 (Applicable for International Students)
Earn Your Accredited Certificate with Transcript
Save 20% with the coupon code SKILL20
Show Your Certified Identity with a CPD-QS Certificate
Perfect for employers, clients, or academic verification.
Get a QLS Certificate to Showcase Your Skills
Detailed record of your completed modules and qualifications.
Frequently Asked Questions
The course is fully online and self-paced, allowing flexible completion.
No prior analytics background is required.
Yes, learners receive a recognised certificate after completion.
Learners are guided through installing the free full version of Tableau.
Yes, it introduces skills relevant to analytics and reporting roles.
Data Analytics with Tableau Reviews
Excellent
98%
Would Recommend142
Certified Learners100%
Authentic Reviews
A well-organised and highly valuable course with clear, easy-to-understand guidance throughout. I’ve gained knowledge that’s directly relevant to my day-to-day responsibilities. It’s given me greater confidence in applying these skills professionally.
Engaging content delivered in a straightforward and structured format. The examples were realistic and helped reinforce key concepts effectively. I would certainly recommend it to colleagues looking to upskill
Comprehensive, insightful and professionally presented from start to finish. The course materials were clear and well supported. A worthwhile investment for anyone serious about career development
Curriculum
-
Introduction to the Course
00:02:00
-
What is Tableau?An Introduction to Tableau
00:03:00
-
How this course is Structured
00:01:00
-
Installing the Free Full Version of Tableau
00:02:00
-
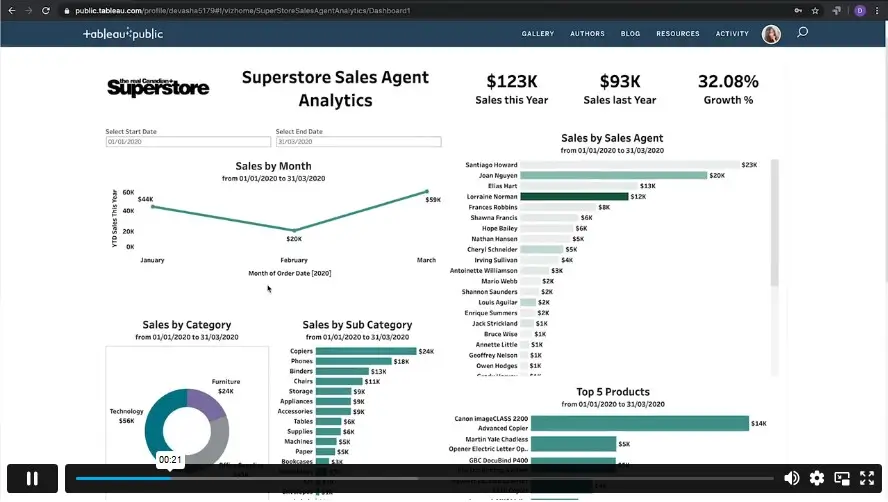
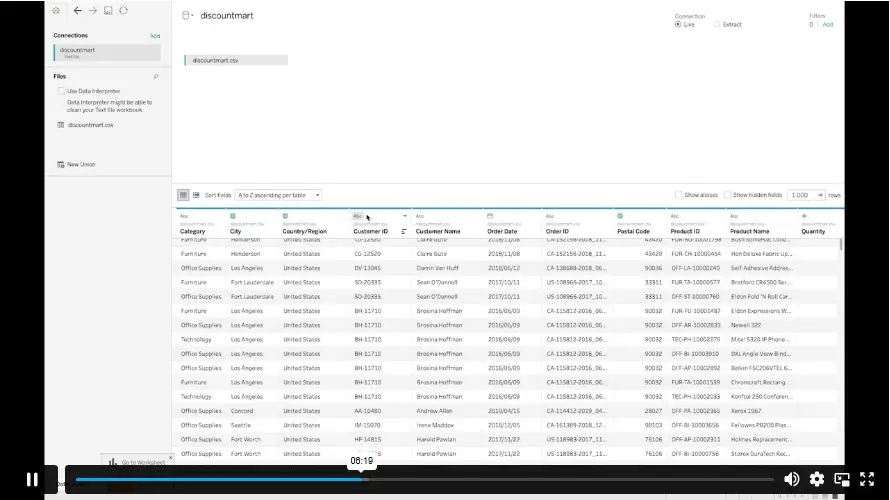
Project Brief for Discount Mart
00:03:00
-
Connecting and Preparing Data for Discount Mart
00:15:00
-
Building Charts on Tableau for Discount Mart (Part 1)
00:33:00
-
Building Charts on Tableau for Discount Mart (Part 2)
00:16:00
-
Creating Headline Cards on Tableau for Discount Mart
00:10:00
-
Building and Publishing Dashboards on Tableau
00:15:00
-
Project Brief for Green Destinations
00:02:00
-
Connecting and Preparing Data for Green Destinations
00:09:00
-
Building Charts on Tableau (Part 1) for Green Destinations
00:29:00
-
Building Charts on Tableau (Part 2) for Green Destinations
00:08:00
-
Creating Headline Cards on Tableau
00:15:00
-
Building a Dashboard for Green Destinations
00:12:00
-
Publish your Dashboard to Tableau Public
00:03:00
-
Project Brief for Super Store
00:02:00
-
Connecting and Preparing Data for Super Store
00:17:00
-
Building Charts on Tableau (Part 1) for Super Store
00:34:00
-
Building Charts on Tableau (Part 2) for Super Store
00:23:00
-
Building a Dashboard
00:18:00
-
Publish your Dashboard to Tableau Public
00:03:00
-
Project Brief for Northwind Trade
00:08:00
-
Connecting and Preparing Data for Northwind Trade
00:14:00
-
Building Charts on Tableau for Northwind Trade
00:37:00
-
Building and Publishing Dashboards for Northwind Trade
00:10:00
-
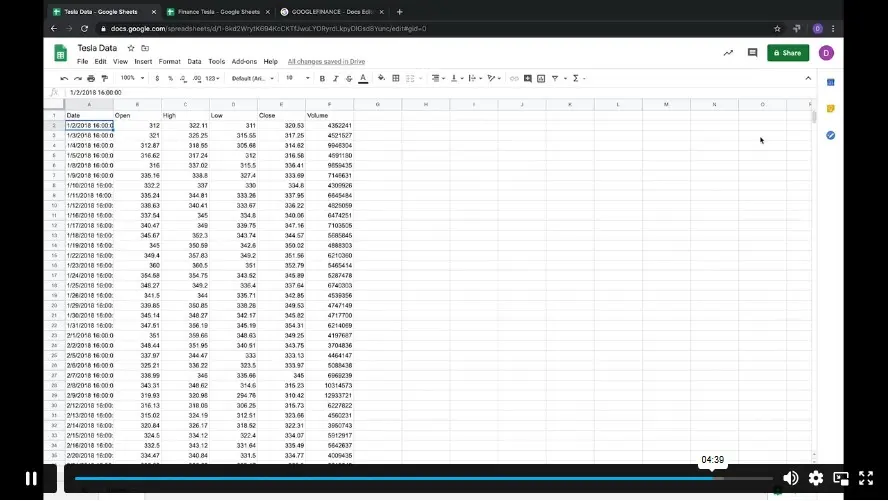
Project Brief for Tesla
00:02:00
-
Creating a Data Source through Google Sheet Functions
00:05:00
-
Connect to the Data for Tesla
00:04:00
-
Building Charts on Tableau for Tesla
00:22:00
-
Building Headline Cards
00:09:00
-
Building a Tesla Dashboard
00:08:00
-
Publish your Dashboard to Tableau Public
00:03:00
-
Introduction to Database Concepts
00:01:00
-
Understanding Relational Databases
00:04:00
-
Relationships of Database Entities
00:02:00
-
Primary and Foreign Keys
00:01:00
-
Data types and Naming Conventions
00:04:00
-
Creating Stories on Tableau
00:05:00
-
Resources – Data Analytics with Tableau
-
Submit Your Assignment & Order QLS Certificate
-
Skill Up Recognised Certificate
-
Order CPDQS Certificate
Offer Ends in
-
Duration:6 hours, 54 minutes
-
Access:1 Year
-
Units:44

56 Reviews

TAKE ALL COURSES FOR £99