
Overview
A Data Analyst transforms raw figures into meaningful direction for organisations. The Data Analyst: Data Analytics with Python, Tableau, SQL programme explores core analytics principles, advanced modelling, and enterprise reporting systems. Learners explore statistical methods, database querying, dashboard design, automation, and big data frameworks. Moreover, this curriculum integrates a Python course, structured Tableau training, SQL systems, Excel analytics, and Power BI reporting to prepare candidates for modern, data-driven decision environments across diverse industries.
Course Description
Numbers speak louder than assumptions; therefore, this programme prepares you to interpret them with clarity and authority. Through a comprehensive Python course, learners explore coding foundations, automation techniques, and analytical workflows. Furthermore, structured Tableau training introduces advanced dashboard development for impactful storytelling. SQL and NoSQL systems, alongside Hadoop frameworks, support scalable data environments. As a result, participants progress confidently from structured datasets to enterprise-level analytics.
In addition, Microsoft Excel training, PowerQuery, and PowerPivot modules strengthen reporting precision. Meanwhile, Power BI modules refine performance tracking and corporate intelligence strategies. Because the Python course integrates machine learning concepts, predictive modelling becomes accessible and measurable. Similarly, the Tableau training component enhances visual interpretation, enabling decision-makers to act swiftly. Consequently, this balanced structure aligns technical depth with commercial relevance.
Finally, big data architecture and database management strengthen analytical capability across multiple platforms. The Python course reinforces algorithmic reasoning, whereas advanced Tableau training sharpens presentation clarity. Therefore, graduates leave prepared for data-centric roles across finance, healthcare, retail, and technology sectors, supported by analytical versatility and strategic reporting expertise.
Course List in this Bundle
- âž½ Course 01: Sql Nosql Big Data and Hadoop All in One Course
- âž½ Course 02: The Complete Python 3 Course: Beginner to Advanced!
- âž½ Course 03: Data Science & Machine Learning with Python
- âž½ Course 04: Microsoft Excel: PowerQuery and PowerPivot
- âž½ Course 05: Microsoft Excel Complete Training
- âž½ Course 06: Data Analytics with Tableau
- âž½ Course 07: Diploma in Data Analysis Fundamentals
- âž½ Course 08: Data Analysis: Getting Results with PowerBI
Learning Outcome
- Apply statistical modelling and analytical frameworks using Python and SQL tools.
- Design interactive dashboards through advanced Tableau and Power BI systems.
- Construct scalable databases using SQL, NoSQL, and Hadoop ecosystems.
- Implement Phlebotomy infection-control procedures
- Interpret machine learning outputs for organisational forecasting strategies.
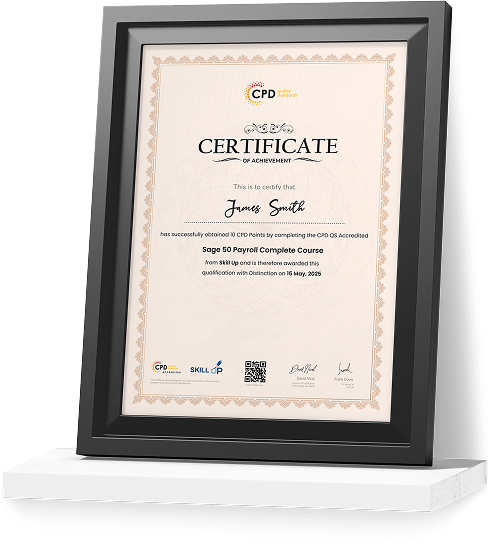
Certificate of Achievement
Earn Your Accredited Certificate with Transcript
Save 20% with the coupon code SKILL20
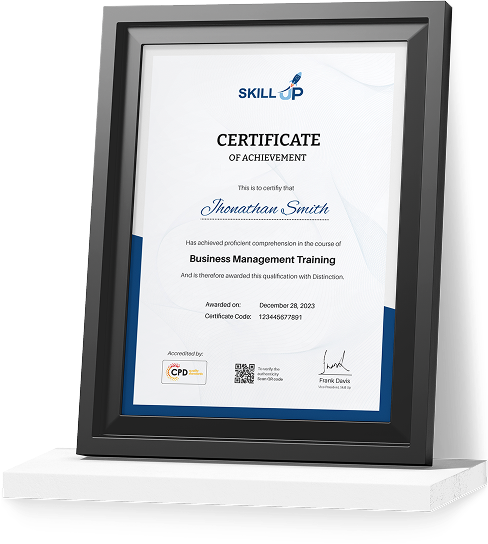
Show Your Certified Identity with a CPD-QS Certificate
Perfect for employers, clients, or academic verification.
Who Is This Course For?
- Graduates seeking analytical roles within UK corporate sectors.
- IT specialists transitioning into database and reporting careers.
- Business professionals aiming to strengthen decision-support capabilities.
- Finance personnel requiring structured reporting expertise.
- Entrepreneurs pursuing data-led operational planning.
Career Path
- Senior Data Analyst : Oversees enterprise reporting systems and strategic modelling. Average Salary Range per Year in the UK: £45,000 – £65,000
- Business Intelligence Manager : Directs dashboard development and corporate analytics strategy. Average Salary Range per Year in the UK: £50,000 – £75,000
- Data Engineering Lead : Manages database architecture and large-scale processing frameworks. Average Salary Range per Year in the UK: £55,000 – £80,000
- Analytics Consultant : Advises organisations on predictive modelling and performance systems. Average Salary Range per Year in the UK: £48,000 – £70,000
- Machine Learning Specialist : Develops predictive algorithms for commercial applications. Average Salary Range per Year in the UK: £60,000 – £85,000
Frequently Asked Questions
Yes. The curriculum starts with foundational analytics before progressing to advanced modelling and reporting systems.
Yes. The Python course and Tableau training are integrated throughout the programme for coding and dashboard expertise.
Yes. SQL, NoSQL, and Hadoop frameworks form a core component of the database modules.
Yes. The programme aligns with senior analytics, intelligence, and data leadership positions exceeding £40,000 annually.
Yes. Microsoft Excel, PowerQuery, PowerPivot, and Power BI modules are included for comprehensive reporting capability.
Data Analyst: Data Analytics with Python, Tableau, SQL Reviews
Excellent
98%
Would Recommend1
Certified Learners100%
Authentic Reviews
A well-organised and highly valuable course with clear, easy-to-understand guidance throughout. I’ve gained knowledge that’s directly relevant to my day-to-day responsibilities. It’s given me greater confidence in applying these skills professionally.
Engaging content delivered in a straightforward and structured format. The examples were realistic and helped reinforce key concepts effectively. I would certainly recommend it to colleagues looking to upskill
Comprehensive, insightful and professionally presented from start to finish. The course materials were clear and well supported. A worthwhile investment for anyone serious about career development
Curriculum
Offer Ends in
14-Day Money-Back Guarantee
-
Duration:Self-paced Learning
-
Access:1 Year

12 Reviews