
Cart
No products in the basket.
Log In Sign Up

Login

Data Analysis: Getting Results with PowerBI

Get 92% Discount | CPD Accredited | Affordable Pricing | No Hidden Charges | 24/7 Tutor Support | Instant Access
4.7
★ ★ ★ ★ ★
★ ★ ★ ★ ★
22 Reviews

stds180 Students

Accreditation Icon
Accreditation Icon

Overview

CPD Accredited Power BI Course. Learn to transform raw data into interactive dashboards, insightful reports, and business intelligence solutions using Microsoft Power BI.

Data is only valuable when it can be understood and acted upon. Whether you’re preparing for a career in data analysis, business intelligence, or reporting, or looking to improve the way you present business data, this course develops the knowledge needed to create professional reports and meaningful visualisations with Microsoft Power BI. You’ll learn how to import data, build interactive visuals, use Power Query, apply calculations, and create dashboards that support informed business decisions.

Throughout this course, you will explore:

✓ Importing and combining data from multiple sources for accurate reporting.

✓ Creating interactive visuals, dashboards, charts, maps, and slicers.

✓ Using Power Query and calculations to prepare and transform datasets.

✓ Building professional reports that support data analytics and business intelligence.

Whether you’re exploring a Power BI online course UK, developing reporting skills for your current role, or preparing for data analytics positions, this course provides a solid foundation in dashboard creation, data visualisation, and modern business reporting.

Course Description

This Power BI training UK course introduces the complete reporting journey. You start with the Power BI interface and learn how to move around the workspace with confidence. Then, you explore how to bring data together from different sources—an essential skill for reporting, analysis, business intelligence, and modern data analytics solutions.

As the course develops, you move into visual reporting. You will create reports that communicate data clearly and professionally. You will learn how to create your first visual, work with information from multiple tables, and use slicers to improve the way users explore reports. In addition, the course covers combo charts, map visuals, and date-based reporting. These features help you present trends, comparisons, and performance data more clearly.

You will also explore Power Query, percentage calculations, and custom calculations. As a result, you can understand how data is shaped, refined, and prepared before final reporting. The course concludes by bringing these skills together into a more complete reporting view. Delivered as a flexible Power BI online course UK, this programme is well suited to learners aiming to strengthen their knowledge of reporting, dashboard creation, and business intelligence tools.

Key Benefits of This Course

When choosing a Power BI course online UK, the real question is not just what the course includes, but what it enables you to do with confidence afterwards.

This course is designed to help you move from simply viewing data to using it with greater clarity, confidence, and professional value.

Learning Outcomes

By the end of this Power BI data analysis course, you will be able to:

Who Is This Course For?

Certificate of Achievement

Earn Your Accredited Certificate with Transcript

Save 20% with the coupon code SKILL20
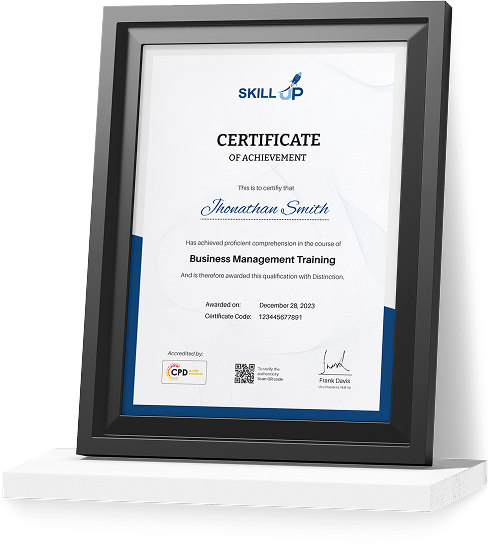
Show Your Certified Identity with a CPD-QS Certificate

Perfect for employers, clients, or academic verification.

Career Path

After completing this Power BI training UK course, you may pursue roles such as:

These roles continue to grow across finance, retail, logistics, healthcare, consulting, and other sectors where data visibility directly affects performance. Many of these roles contribute to data analytics services, helping organisations improve reporting, business performance, and strategic decision-making through data.

Frequently Asked Questions

Power BI is Microsoft’s business intelligence and data visualisation platform used to connect data, build dashboards, create reports, and uncover trends. It is widely used across UK organisations to turn raw business data into clearer insights that support reporting, planning, and decision-making.

Yes. This course is suitable for beginners who want a structured introduction to dashboards, reporting, and data visualisation. It starts with the screen layout and core functions, then builds into visuals, slicers, calculations, and reporting techniques, making it a strong option for learners seeking Power BI for beginners in the UK.

A Power BI data analysis course teaches you how to connect data from different sources, build visuals, create reports, use slicers, work with multiple tables, and improve reporting through calculations and Power Query.

Yes. Power BI certification UK can strengthen your CV and show employers that you understand data reporting, dashboard creation, and business intelligence tools.

After completing Power BI training UK, learners may pursue roles such as Data Analyst, Reporting Analyst, Business Intelligence Analyst, Operations Analyst, and Data Visualisation Specialist. These are some of the most popular data analytics positions in today’s UK job market.

Power BI-related salaries in the UK vary by job title, experience, and sector. Entry-level reporting and data analysis roles may start from around £28,000 to £35,000, while more experienced Business Intelligence Analysts and Power BI specialists can earn £45,000 to £60,000+. Developing strong skills through a Microsoft Power BI course UK can support progression into higher-paying data roles.

The average data analyst salary UK varies depending on experience, location, and industry. Entry-level professionals typically earn between £28,000 and £35,000, while experienced Data Analysts and Business Intelligence professionals can earn £45,000–£60,000+. Building Power BI and reporting skills can improve your career prospects and support progression into higher-paying analytics roles.

Data Analysis: Getting Results with PowerBI Reviews

Excellent

4.7 / 5
Based on 22 reviews

98%

Would Recommend

180

Certified Learners

100%

Authentic Reviews
Ethan Bradley

A fantastic introduction to Power BI with clear lessons that made reporting and dashboards easy to understand.

Freya Mitchell

The course was practical, engaging, and helped me build confidence using Power BI from the very beginning.

Joshua Pearson

Excellent step-by-step guidance. I can now create reports and visuals much more confidently.

Curriculum

  • play Module 01: Tour of the screen
    play 00:04:00
  • play Module 02: Pulling in your data from different sources
    play 00:12:00
  • play Module 03: Creating your first Visual
    play 00:09:00
  • play Module 04: Building a visual from 2 tables
    play 00:08:00
  • play Module 05: Slicers
    play 00:07:00
  • play Module 06: Making a Combo Chart Visual
    play 00:06:00
  • play Module 07: Using PowerQuery to restructure the data
    play 00:04:00
  • play Module 08: Creating Map Visuals
    play 00:03:00
  • play Module 09: Creating a report by Year, Qtr, or Month
    play 00:04:00
  • play Module 10: Calculating % of total
    play 00:02:00
  • play Module 11: Creating your own Calculation
    play 00:05:00
  • play Module 12: Decomposition Tree Visual
    play 00:02:00
  • play Module 13: Pulling it all together
    play 00:09:00
top