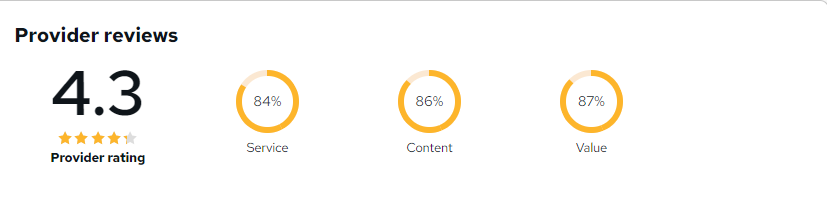
.png) 9 Reviews
9 Reviews 2 Students
 Course Highlights
 Learning outcome
 Learning outcome
 Course media
Why should I take this course?
 Why should I take this course?
 Requirements
 Requirements
Python for Data Visualization: The Complete Masterclass Reviews

A well-organised and highly valuable course with clear, easy-to-understand guidance throughout. I’ve gained knowledge that’s directly relevant to my day-to-day responsibilities. It’s given me greater confidence in applying these skills professionally.

Engaging content delivered in a straightforward and structured format. The examples were realistic and helped reinforce key concepts effectively. I would certainly recommend it to colleagues looking to upskill

Comprehensive, insightful and professionally presented from start to finish. The course materials were clear and well supported. A worthwhile investment for anyone serious about career development
Curriculum
-
Installing the Anaconda Navigator
00:07:00
-
Installing Matplotlib, seaborn & cufflinks
00:03:00
-
Reading data from a csv file with pandas
00:03:00
-
Explaining Matplotlib libraries apart
00:07:00

 00:07:00
-
Changing the axis scales
00:06:00
-
Label Styling
00:04:00
-
Adding a legend
00:04:00
-
Changing colors, linestyles, linewidth and markers
00:09:00
-
Adding a grid to the chart
00:04:00
-
Filling only a specific area
00:07:00
-
Filling area on line plots and filling only specific area
00:04:00
-
Changing fill color of different areas (negative vs positive for example)
00:03:00
-
Changing edge color and adding shadow on the edge
00:04:00
-
Adding legends, titles, location and rotating pie chart
00:06:00
-
Histograms vs Bar charts (Part 1)
00:03:00
-
Histograms vs Bar charts (Part 2)
00:02:00
-
Changing edge colour of the histogram
00:03:00
-
Changing the axis scale to log scale
00:07:00
-
Adding median to histogram
00:04:00
-
Advanced Histograms and Patches (Part 1)
00:04:00
-
Advanced Histograms and Patches (Part 2)
00:05:00
-
Overlaying bar plots on top of each other (Part 1)
00:04:00
-
Overlaying bar plots on top of each other (Part 2)
00:01:00
-
Creating Box and Whisker Plots
00:11:00
-
Plotting a basic stack plot
00:13:00
-
Plotting a stem plot
00:05:00
-
Plotting a stack plot od data with constant total
00:04:00
-
Plotting a basic scatter plot
00:06:00
-
Changing the size of the dots
00:06:00
-
Changing colors of markers
00:05:00
-
Adding edges to dots
00:04:00
-
Using the Python datetime module
00:03:00
-
Connecting data points by line
00:04:00
-
Converting string dates using the .to_datetime() pandas method
00:05:00
-
Plotting live data using FuncAnimation in matplotlib
00:04:00
-
Setting up the number of rows and columns
00:04:00
-
Plotting multiple plots in one figure
00:02:00
-
Getting separate figures
00:03:00
-
Saving figures to your computer
00:03:00
-
Introduction to seaborn
00:02:00
-
Working on hue, style and size in seaborn
00:05:00
-
Subplots using seaborn
00:05:00
-
Line plots
00:02:00
-
Cat plots
00:03:00
-
Jointplot, pair plot and regression plot
00:02:00
-
Controlling Plotted Figure Aesthetics
00:03:00
-
Installation and Setup
00:02:00
-
Line, Scatter, Bar, box and area plot
00:07:00
-
3D plots, spread plot and hist plot, bubble plot, and heatmap
00:07:00
-
Order Your Certificate

Offer Ends in

-
Duration:3 hours, 44 minutes
-
Access:1 Year
-
Units:50