
Overview
Have you ever looked at a trading chart and wondered how experienced traders read price moves before the market clearly shifts? The Technical Analysis Masterclass for Trading & Investing helps you build that structured clarity. Whether you are a trading analyst, retail trader, or investor, this course develops a disciplined approach to financial markets using proven chart methods.
Across stocks, forex, and crypto, many beginners struggle due to unstructured price interpretation. This technical analysis course online teaches how market structure, momentum, and trader behaviour connect in real time. Key areas include:
✓ Candlestick behaviour and price action.
✓ Support, resistance, and trends.
✓ Volume confirmation techniques.
✓ Structured technical trading strategies.
By completing this stock market technical analysis course, you will read charts with confidence and make more consistent trading decisions.
Course Description
This Technical Analysis Masterclass for Trading & Investing is structured to take you from foundational chart understanding to advanced strategy development in a clear and progressive learning flow.
The course begins with core principles of technical analysis for beginners, helping you understand how price forms, how trends develop, and how market participants influence movement. This stage builds essential clarity before moving into deeper analytical techniques.
You will then explore a detailed candlestick analysis course, where candlestick structures, market psychology, and price action behaviour are carefully examined. This helps you understand how traders interpret momentum shifts and potential reversals.
Next, the programme expands into a complete chart pattern trading course, covering trendlines, head and shoulders formations, flags, breakouts, and continuation structures. These patterns help you identify potential market opportunities before major movements develop.
A dedicated section focuses on volume analysis techniques, including VWAP, OBV, volume profile, and supply-demand interpretation. These tools help validate price movements and improve decision confidence across different market conditions.
The final stage brings everything together through technical trading strategies course content, combining breakout trading, momentum-based approaches, and structured risk control frameworks. You will also learn platform setup and guided market scenarios to understand real-world application.
To further strengthen professional positioning, the course also supports learners aiming for technical analysis certification, helping demonstrate structured knowledge of market analysis and trading principles.
Learning Outcome
- Understand core principles of technical analysis for trading & investing.
- Interpret candlestick patterns and market sentiment with structured clarity.
- Identify support, resistance, and trend formations across multiple markets.
- Apply volume-based tools such as VWAP, OBV, and volume profile effectively.
- Analyse chart patterns including breakouts, reversals, and continuation setups.
- Develop structured technical trading strategies for consistent decision-making.
- Demonstrate disciplined risk management and trade planning techniques
- Build foundational knowledge aligned with technical analysis certification standards.
Who Is This Course For?
- Aspiring retail traders who want a structured technical analysis course online to understand market behaviour.
- Beginners searching for a step-by-step technical analysis for beginners learning path.
- Individuals aiming to build skills in stock market technical analysis course concepts for equities and indices.
- Forex learners seeking a structured forex technical analysis course foundation for currency trading.
- Crypto enthusiasts who want to understand chart behaviour using technical methods.
- Self-learners studying candlestick trading course and price action strategies.
- Career-focused learners preparing for roles requiring technical analysis certification or trading knowledge.
Certificate of Achievement
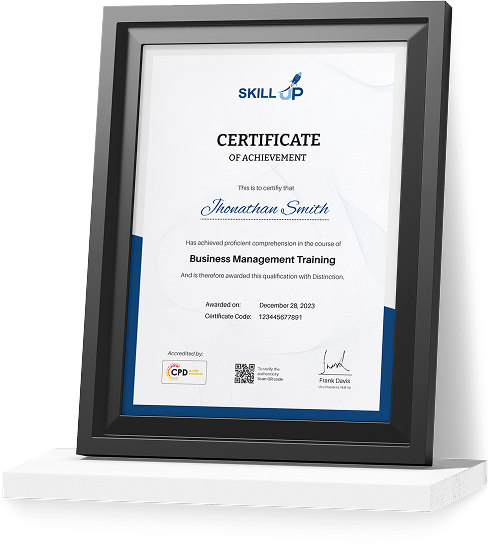
Upon successfully completing this Technical Analysis Masterclass for Trading & Investing, learners will receive an Accredited Certificate confirming their knowledge of technical analysis systems, chart analysis, and trading strategy development.
We provide two recognised certificate options:
CPD-QS Certificate
Learners can obtain a certificate accredited by CPD Quality Standards (CPD-QS). This accreditation confirms that the course meets recognised Continuing Professional Development standards and supports professional development in trading, investment analysis, and financial market education.
SKILL UP Brand Recognised Certificate
Learners will also receive a SKILL UP Certificate of Completion. This certificate verifies that you have successfully completed the training and achieved the required learning outcomes related to technical analysis, candlestick patterns, volume analysis, trading systems, and market strategy evaluation.
Both certificates demonstrate that you have developed knowledge of technical trading frameworks and financial market analysis techniques.
Earn Your Accredited Certificate with Transcript
Save 20% with the coupon code SKILL20
Show Your Certified Identity with a CPD-QS Certificate
Perfect for employers, clients, or academic verification.

Career Path
- Retail Trader (Stock/Forex Trader): This role involves independently analysing charts, identifying trade setups, executing positions, and managing risk using structured technical methods. Retail traders operate across stocks, forex, and crypto markets, often building strategies based on price action and indicators.|Earnings vary widely, typically ranging from £25,000–£80,000+, depending on skill level, discipline, and trading capital.
- Trading Analyst: Trading analysts support professional trading environments by studying price movements, market structure, and technical indicators. They help traders and teams make informed decisions through structured chart analysis.|Salaries generally fall between £30,000–£55,000, with growth based on experience and analytical accuracy.
- Investment Research Assistant: This role focuses on supporting investment teams through equity analysis, chart interpretation, and structured market research. In addition, assistants help identify potential opportunities using technical insights.|The average salary ranges from £28,000–£50,000, depending on organisation size and expertise.
- Financial Market Analyst: Financial market analysts evaluate market trends, price behaviour, and trading signals to produce actionable insights for institutions. They often work with both short-term and long-term data to guide financial decisions.|Salaries typically range from £35,000–£65,000, with higher pay for specialised expertise.
- Crypto Market Analyst: This role focuses on digital asset markets, where analysts study volatility, chart patterns, and technical indicators to identify trading opportunities. Because crypto markets move quickly, decision-making speed and accuracy are essential.|Earnings usually fall between £30,000–£70,000, depending on experience and market exposure.
- Prop Trading Assistant: Prop trading assistants support trading desks by monitoring setups, analysing charts, and applying knowledge of structured technical trading strategies in live market environments. They often work in fast-paced conditions where precision matters.|Salaries typically range from £40,000–£75,000+, with performance-based progression opportunities.
Frequently Asked Questions
A structured technical analysis masterclass for trading & investing is ideal. It covers price action, candlesticks, chart patterns, and volume analysis. This technical analysis course online helps you build real market skills for stocks, forex, and crypto instead of relying on signals.
The most effective approach is rule-based technical analysis for trading & investing, using price action, trend structure, and volume confirmation. Methods like breakout and momentum trading from a technical analysis trading course improve consistency.
Most traders fail due to emotion, poor risk control, and lack of structure. Without a stock market technical analysis course, they depend on indicators instead of market structure and disciplined technical trading strategies.
Key tools include candlestick charts, trendlines, support and resistance, VWAP, and volume indicators. A strong candlestick trading course and chart pattern trading course helps traders combine these tools to identify high-probability setups across markets.
Yes. Technical analysis works across all markets. A forex technical analysis course uses the same principles of price action, trends, and patterns across different assets.
Yes, a technical analysis course for beginners helps you read charts, understand trends, and build structured trading habits using proven technical trading strategies course methods.
Technical Analysis Masterclass for Trading & Investing Reviews
Excellent
98%
Would Recommend110
Certified Learners100%
Authentic Reviews
A well-organised and highly valuable course with clear, easy-to-understand guidance throughout. I’ve gained knowledge that’s directly relevant to my day-to-day responsibilities. It’s given me greater confidence in applying these skills professionally.
Engaging content delivered in a straightforward and structured format. The examples were realistic and helped reinforce key concepts effectively. I would certainly recommend it to colleagues looking to upskill
Comprehensive, insightful and professionally presented from start to finish. The course materials were clear and well supported. A worthwhile investment for anyone serious about career development
Curriculum
-
Introduction
00:02:00
-
1.1 Technical Analysis
00:01:00
-
2.1 Candlestick Charts
00:05:00
-
2.2 Anatomy of Candlesticks
00:04:00
-
2.3 Demand and Supply in Candlestick Pattern
00:08:00
-
2.4 Support and Resistance
00:12:00
-
2.5 Standard Doji
00:05:00
-
2.6 Dragonfly Doji
00:03:00
-
2.7 Gravestone Doji
00:06:00
-
2.8 Engulfing Candles
00:08:00
-
2.9 Morning & Evening Stars
00:09:00
-
2.10 Hammer & Hanging Man Candles
00:07:00
-
2.11 Mat Hold Pattern
00:05:00
-
2.12 3-Methods Pattern
00:06:00
-
2.13 Gaps Between Candlesticks
00:03:00
-
2.14 Gap Close Reversal Strategy
00:05:00
-
3.1 Trendlines
00:04:00
-
3.2 Head and Shoulders Pattern: H&S
00:06:00
-
3.3 Inverse Head & Shoulders Pattern: IH&S
00:02:00
-
3.4 Bull Flag
00:03:00
-
3.5 Bear Flag
00:03:00
-
3.6 ABCD Pattern
00:05:00
-
3.7 Pattern Practice
00:04:00
-
4.1 Volume
00:07:00
-
4.2 Adding Volume Indicators On Charts
00:07:00
-
4.3 Using VWAP: Volume Weighted Average Price
00:11:00
-
4.4 Using OBV: On-Balance Volume
00:06:00
-
4.5 Volume Profile
00:08:00
-
4.6 Supply & Demand In Volume
00:09:00
-
4.7 Stock Breakouts & Volume
00:05:00
-
4.8 Volume Exhaustion
00:07:00
-
4.9 Analysis and Example
00:08:00
-
5.1 Level1 vs. Level2
00:03:00
-
5.2 Supply & Demand In The Tape
00:06:00
-
5.3 Time & Sales
00:03:00
-
5.4 Tape Reading
00:02:00
-
5.5 The Importance Of Tape Reading
00:03:00
-
5.6 Hidden Buyers
00:11:00
-
5.7 Hidden Sellers
00:09:00
-
5.8 Fakeouts & Manipulation Tactics
00:05:00
-
5.9 Identifying Reversals With The Tape
00:08:00
-
6.1 Managing Risk
00:05:00
-
6.2 Breakout Trading Strategy
00:09:00
-
6.3 Momentum Trading Strategy
00:08:00
-
7.1 Setting Up Trading Platform
00:30:00
-
7.2 Risk Free Trading Strategies
00:07:00
-
Assignment -Technical Analysis Masterclass for Trading & Investing
-
Order Your Certificate

Offer Ends in
-
Duration:4 hours, 53 minutes
-
Access:1 Year
-
Units:48

9 Reviews

TAKE ALL COURSES FOR £99